Playwriter vs Chrome Direct CDP
Chrome has a built-in remote debugging mode that exposes the Chrome DevTools Protocol (CDP) over a WebSocket.
You can launch Chrome with
--remote-debugging-port=9222 or enable it at chrome://inspect/#remote-debugging.
This is what most automation tools use under the hood.The problem: Chrome now shows a permission dialog every time an external app tries to connect.

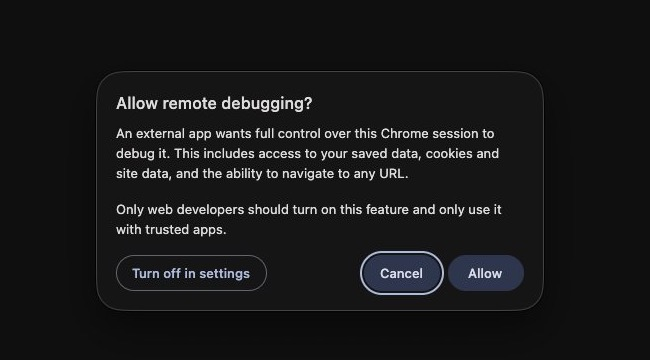
The dialog says "An external app wants full control over this Chrome session to debug it" and requires
the user to click Allow before any automation can start. The Cancel button is visually
highlighted as the recommended action. This is by design; Chrome wants to prevent background
processes from silently hijacking browser sessions.
This single dialog breaks every autonomous agent use case. An agent can't click Allow
on its own. The user must be present, watching, and ready to click every time the agent
reconnects. If Chrome restarts, the dialog appears again. If the connection drops, the dialog
appears again.
There is a second, stricter limit. Since Chrome 136,
--remote-debugging-port is
ignored on your default profile as a security mitigation. You must launch with a
throwaway --user-data-dir, which is a fresh profile with none of your logins or extensions.
So Chrome's built-in CDP either can't touch your real profile at all, or triggers a dialog
you have to approve by hand.How Playwriter avoids the dialog
Playwriter uses a Chrome extension with
chrome.debugger permissions instead of external CDP
connections. The extension runs inside Chrome, so it never triggers the remote debugging
permission dialog. The user clicks the extension icon once on a tab, and the agent has full
CDP access from that point forward.No flags, no Chrome restart, no recurring permission prompts.
Comparison
| Playwriter | Chrome Direct CDP | |
| Permission dialog | Never | Every connection |
| Autonomous agents | Works unattended | Blocked by dialog |
| Chrome restart needed | No | Yes (--remote-debugging-port) |
| Login state | Already logged in | Depends on profile flags |
| User intervention | One-time extension click | Required every reconnect |
| Extensions available | Yes | Yes |
| Full CDP access | Yes | Yes |
Chrome Direct CDP setup
To use Chrome's built-in CDP, you need to either:
- Launch Chrome with a flag:
chrome --remote-debugging-port=9222 - Enable in settings: navigate to
chrome://inspect/#remote-debugging
Both approaches expose a WebSocket endpoint that automation tools can connect to.
But the moment any tool connects, Chrome shows the "Allow remote debugging?" dialog.
With Playwriter's
--direct mode, you can still use Chrome's built-in CDP when you
need it (for example, to access all open tabs at once). But for most agent workflows,
the extension mode is better because it avoids the dialog entirely.# Extension mode (recommended): no dialog, no flags playwriter session new playwriter -s 1 -e "state.page = await context.newPage(); await state.page.goto('https://example.com')" # Direct mode: uses built-in CDP, dialog appears once playwriter session new --direct playwriter -s 1 -e "state.page = await context.newPage(); await state.page.goto('https://example.com')"
Why this matters for agents
AI agents need to operate without human babysitting. A permission dialog that requires
a click defeats the purpose. The agent can't proceed until someone is there to approve it,
and there's no API to auto-accept the dialog.
With Playwriter, the user enables the extension on the tabs they want controlled, then walks
away. The agent can reconnect, navigate, and automate freely. If Chrome restarts, the
extension reconnects automatically when the user opens Chrome again. No dialog, no flags,
no friction.